Wall Street University: Betting Markets (Part I)
How statistical models have shaped the world from their birth in 1740's Scotland to modern day Wall Street

Intro
This series was created to teach complex trading and investment models through a simple and fun exercise: Betting Markets.
As a professional trader, I’ve always been interested in betting markets, especially markets which have quality data but are inefficient.
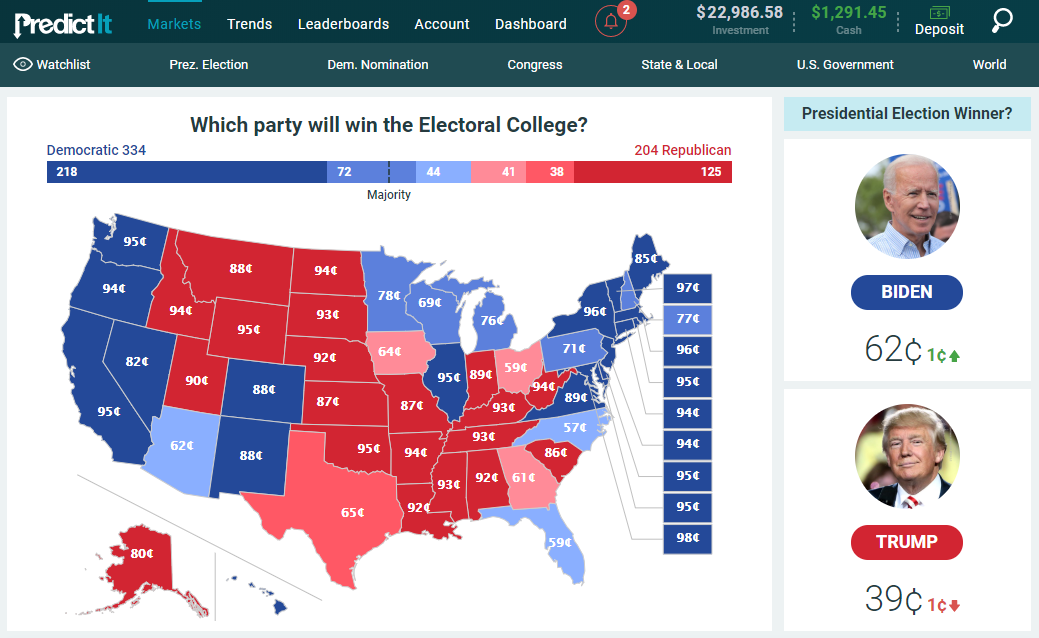
The US Presidential Election markets on PredictIt.org are used as an example throughout this series.
PredictIt is a legal and easy-to-use website with live betting on a variety of elections and political events. For further reference, PredictIt is covered in detail in Part III.
This series will cover how to:
- Build a statistical model
- Compare the model simulations to live betting markets
- Find the most attractive bets (markets with large discrepancies to the model)
- Combine these bets to build an optimal portfolio
The aim is to clearly introduce some of the statistical modeling, trade sizing, and risk assessment that I provide professionally as a hedge fund portfolio manager.
Sandbox Example
PredictIt provides an excellent “sandbox” project to learn some useful skills.
Graduate school financial engineering programs cover models similar to this series, though the projects are often simpler and rarely introduce more than one complication at a time. Typically the new concept each week is so clearly defined that complexity and convolution are nonexistent. In the end, the projects bear no resemblance to reality.
Conversely, data is noisy and complex in the real world. Probabilities are unknown. Correlations are undefined and changing. The best application of models and prediction is only correct 51-52% of the time.
Many academic models, like Efficient Market Hypothesis, Modern Portfolio Theory, Capital Asset Pricing Model, bear no relation to real markets. Other models are only loosely useful in application, such as Black Scholes.
Applying the concepts from statistics, physics and machine learning in financial trading requires deeper understanding, observation and experience.
PredictIt
PredictIt offers an excellent middle ground that is comfortably complex, yet discrete, with quality real world data including polls and historical voting. It offers live markets, some prices discrepancies, and correlations. PredictIt provides you with all the basic elements of traditional markets. It even has Bid/Offer spread, taxes and exchanges fees!
All of the markets on PredictIt have a maturity date (November 3rd) and clearly defined relationships (Biden wins or Trump wins). It is easy to tell when events are mutually exclusive or infer correlations from historical voting patterns (e.g. when comparing Texas to Alaska for voting similarities).
After you work through this eight-part series, it should be easier to understand these models and apply them in engineering, finance and other fields.
Turns out politics are useful for something!
This Series
The models, concepts and betting decisions are organized into a series of eight articles (Precise ≠ Concise).
Part II: Building Blocks & Covariance
Part III: PredictIt & The Mechanics of Markets
Part IV: The Best Bets (Statistically) & Two-Bet Portfolios
Part V: Optimal Portfolios & The Efficient Frontier
Part VI: Polling Models, Internal Models & Large Portfolios > $20,000
Part VII: The Math, The Code & Visualizing 10,000-Dimensional Spaces
Part VIII: 2018 Elections & Becoming a Portfolio Manager
This isn’t a Netflix series you need to binge all the way through, so feel free to skip to the appropriate sections depending on your interests and motivation.
Are you looking for the best bets on PredictIt? Don’t care how the model is made?
Skip to Part IV & Part V.
Are you already a Quant and you want to learn more about how my model works and or how technical difficulties are tackled?
Check out Part VII & The Kelly Criterion.
Curious about models, trading and a career? Then I would suggest reading the full series & The Kelly Criterion.
Additionally, as markets move and new polls are published, the output will need to be periodically updated. Sign up for my weekly email or follow me on Twitter for refreshed markets, polls and optimal bets.
The Power of Models
What is a model?
The model we will be exploring is not a model car or airplane, but a human construct which is used to predict reality — a “toy” version that behaves just like the real world.
I could simulate a game of Monopoly or backgammon using a model for dice (1-in-6 probability of a side landing face up), or (maybe more fun) a model that simulates weather or rainfall to determine the likelihood of a flood or dam burst. A model assumes and simplifies — it makes the real world more accessible to experimentation. If statistical and financial models are unclear to you, then that’s what this series is for.
“All models are wrong, but some are useful.” -George Box (Statistician)
Models allow us to try novel approaches, prepare for disasters and work out engineering problems. For example, before building a house, a blueprint is first made so that materials can be calculated. Similarly, business decisions and forecasts are often modeled first in Excel. The Pentagon models war scenarios and epidemiologists model disease spread.
The Birth of Computational Finance
Did you know that the world’s first high-quality statistical model was created for finance?
In his book Sapiens Yuval Noah Harari discusses early modeling:
In 1744, two Presbyterian clergymen in Scotland, Alexander Webster and Robert Wallace, decided to set up a life-insurance fund that would provide pensions for the widows and orphans of dead clergymen. They proposed that each of their church’s ministers would pay a small portion of his income into the fund, which would invest the money. If a minister died, his widow would receive dividends on the fund’s profits. This would allow her to live comfortably for the rest of her life. But to determine how much the ministers had to pay in so that the fund would have enough money to live up to its obligations, Webster and Wallace had to be able to predict how many ministers would die each year, how many widows and orphans they would leave behind, and by how many years the widows would outlive their husbands.
Being Scots, they were practical types. So they contacted a professor of mathematics from the University of Edinburgh, Colin Maclaurin. The three of them collected data on the ages at which people died and used these to calculate how many ministers were likely to pass away in any given year.

Their work was founded on several recent breakthroughs in the fields of statistics and probability. One of these was Jacob Bernoulli’s Law of Large Numbers.
Bernoulli had codified the principle that it might be difficult to predict with certainty a single event, such as the death of a particular person, it was possible to predict with accuracy the average outcome of many similar events.
That is, while Maclaurin could not use maths to predict whether Webster and Wallace would die next year, he could given enough data, tell Webster and Wallace how many Presbyterian ministers in Scotland would almost certainly die next year. Fortunately, they had ready-made data that they could use. Actuary tables published fifty year previously by Edmond Halley proved particularly useful. Halley had analysed records of 1,238 births and 1,174 deaths that he obtained from the city of Breslau, Germany. Halley’s tables made it possible to see that, for example, a twenty-year-old person has a 1:100 chance of dying in a given year, but a fifty-year-old person had a 1:39 chance.
Processing these numbers, Webster and Wallace concluded that, on average, there would be 930 living Scottish Presbyterian ministers at any given moment, and an average of twenty-seven ministers would die each year, eighteen of whom would be survived by widows. Five of those who did not leave widows would leave orphaned children, and two of those survived by widows would also be outlived by children from previous marriages who had not yet reached the age of sixteen. They further computed how much time was likely to go by before the widows’ death or remarriage (in both these eventualities, payment of the pension would cease). These figures enabled Webster and Wallace to determine how much money the ministers who joined their fund had to pay in order to provide for the their loved ones. By contributing £2 12s. a year, a minister could guarantee that his widowed wife would receive at least £10 a year — a hefty sum in those days. If he thought that was not enough he could choose to pay in more, up to a level of £6 11s. a year — which would guarantee his widow the even more handsome sum of £25 a year.
According to their calculations, by the year 1765, the Fund for a Provision for the Widows and Children of the Ministers of the Church of Scotland would have capital totaling £58,348. Their calculations proved amazingly accurate. When that year arrived, the fund’s capital stood at £58,347 — just £1 less than the prediction! Today, Webster and Wallace’s fund, known simply as Scottish Widows, is one the largest pension and insurance companies in the world. With assets worth £100 billion, it insures not only Scottish widows, but anyone willing to buy its policies.
Statistical modeling has become one of the pillars of modern engineering.
The use of statistical models has only grown since 1744. Today, they govern everything from NASA satellites, to bridge design, air-traffic control and the production of Chicken McNuggets.
If Bernoulli and our Scottish ministers could only see how their models have conquered the world.
Building Blocks
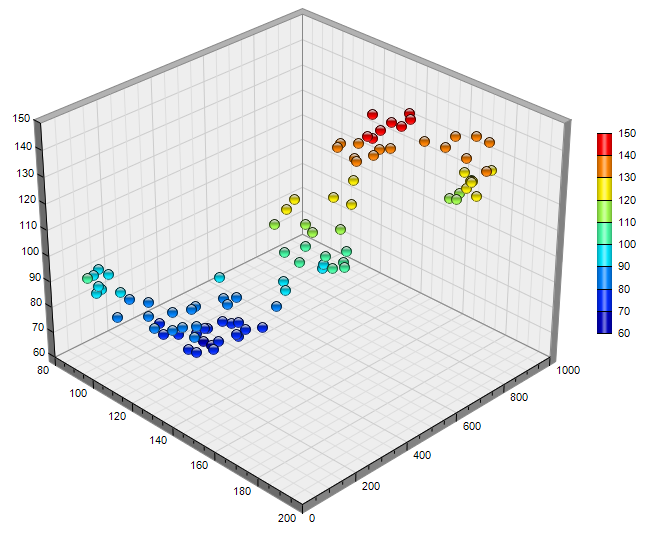
This series continues the proud tradition that began with Jacob Bernoulli. By first constructing a simple model for each US state, then replicating how different states move in tandem and finally utilizing a Monte Carlo model to generate 10,000 possible outcomes for the election.
The model will not know exactly which outcome will occur, but it can accurately determine the relative probabilities of different outcomes (e.g. Biden wins Popular Vote, Trump wins Alaska, etc.).
That is sufficient to value each bet and understand how the bets themselves move together. Some will be correlated, others are mutually exclusive, while still others will bear no discernible relationship.
Ultimately, we can combine a portfolio of different bets that are each mispriced in some way, such that the sum pays off no matter who is elected.
The next part in series Part II: Building Blocks & Covariance describes step-by-step how to construct the model.
Collaboration
For any interesting projects or research, or if you just want to discuss some topic, please reach me at: nickyoder10@gmail.com
Don't forget to sign up for weekly updates to the model, polls and optimal Bets! As market prices change, public polls change and the time until election decreases, I'll update these every week.