In Defense of Polling
How I earned $50,000 on election night using polling data and some Python code.

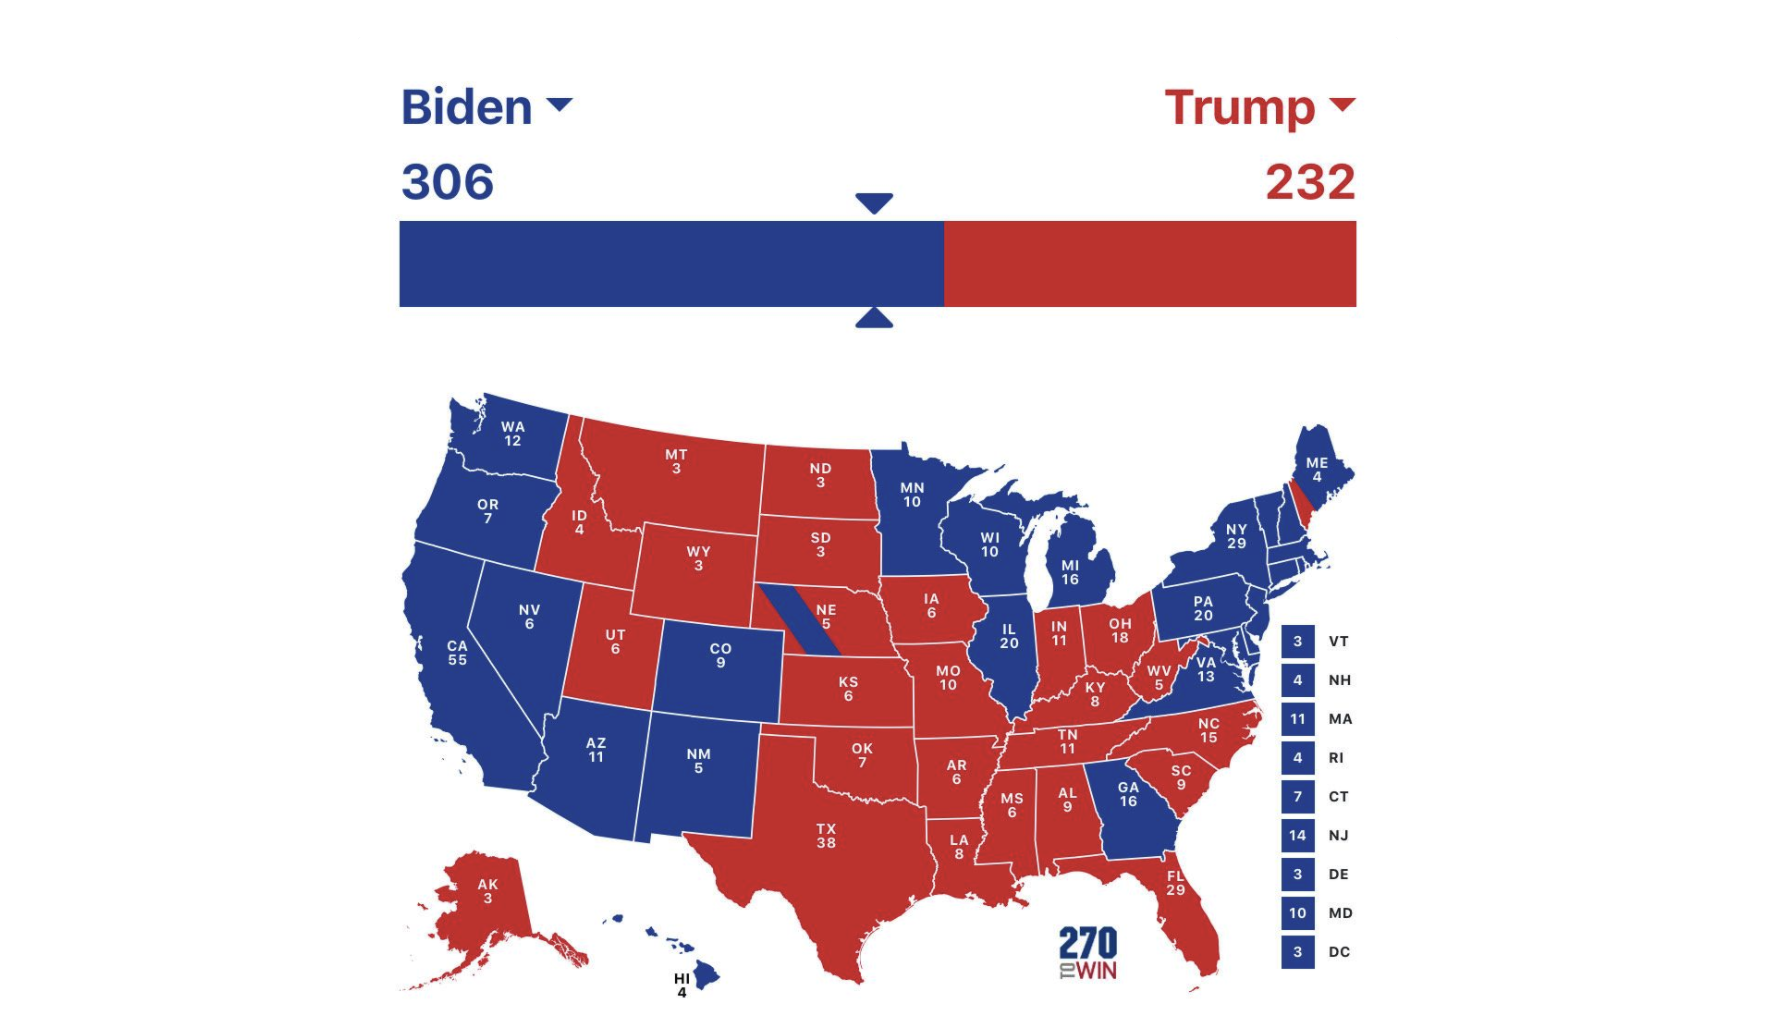
This week's Presidential election saw Joe Biden defeat Donald Trump by a comfortable margin (306-232).
In the weeks leadings up the election, a myriad of polls showed Mr. Biden ahead both nationally and in key swing states. FiveThirtyEight.com gave Biden an 89% chance of winning. Numerous pundits predicted a landslide win.
But with the election now over, a familiar complaint has returned: The polls were wrong.
Many critics, not least of which the outgoing President, have revived the attack that polls are inaccurate and biased. This is the same argument that pundits enjoyed lobbing after 2016. But both are untrue.
In reality, polls were accurate in 2016 and 2020.
What follows is a capitalist's defense of the Science of Polling.
The Model
This summer I decided to build a quantitative model to bet on the presidential election. The code would ingest polling data and spit out predictions for every state, electoral vote and the presidency at large.
As the senior portfolio manager for a quant hedge fund in New York, I often create mathematical models for trading, strategy decisions or just for fun. I've found that many difficult problems can be cracked with some quality data and a statistical framework to understand it.
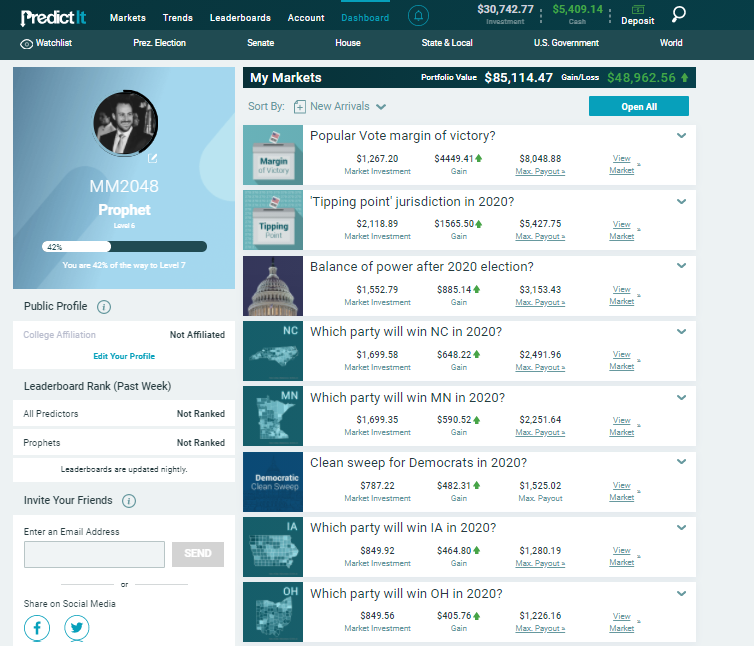
For this project, I utilized a blend of current polls from FiveThirtyEight and historical correlations between states. For betting I used PredictIt.org, which allows legal wagers on a wide range of political markets.
The plan was to value the markets and place a few bets for fun, not more than $2,000.
The Writing
This year I also started writing articles to teach topics in statistics, financial markets and betting. One such article discussed the Kelly Criterion, a formula to balance risk and uncertainty. It would become popular in poker circles. Other articles covered volatility trading, Shiller PE and Hidden Markov models.
The election project was a perfect subject for another article. It offered a clean 'Sandbox' example for concepts of probability, covariance, risk/hedging and portfolios. Eventually it would become a four-part, 25,000 word series.
The goal of the series became to teach quantitative trading as a science. The election and betting markets were just a convenient illustration of complex principles used on Wall Street.
Here's the series:
Part I: What is a Model?
Part II: Building the basics
Part III: Why are there so many opportunities?
Part IV: The best bets and optimal portfolio of bets
As the writing project expanded, so did the size of my bets. By the end of summer, I had wagered over $20,000 in my "Optimal Portfolio".
Statistics & Variance
Despite the size of the bets, the actual risk was minimal. I had constructed positions with high expected value and very little probability of loss.
The model took betting positions in 130 different election markets (each state outcome, electoral votes, popular vote, etc). It utilized covariance assumptions to balance wagers which typically move in similar or opposite directions.
Each wager was calculated and the specific risks quantified. Whether Biden won or Trump, I profited. If voter turnout was high or low, it worked.
Blue wave in the South? Recount in Pennsylvania? No problem. The model works.
It was built on a solid foundation of polling science.
The model was soon corroborated when FiveThirtyEight published their election model later in the summer. FiveThirtyEight had not taken the additional step to value wagers or create an investment portfolio, but the fundamental model looked very similar to mine.
Election Day
At last, November 3rd arrived...
The volume of web traffic Tuesday night crashed PredictIt's website for hours.
Content in the portfolio, my friends and I happily spent the night with board games, wine and no phones or news allowed.
As we played, the talking heads said Trump was up, then down. The Great Lake States looked strong for Biden. Trump won Florida.
Predictably, Pennsylvania was Trump +13 on in-person votes but projected for Biden to win overall. Each race played out within the margins of the expectation.
The polls were right. The model was robust. The bets paid off.
Total profit ~$50,000.
Ultimately, this statistical/polling model was correct on over 90% of bets.
Post Mortem
Now that the dust has settled, Biden is projected to win 306-232 and easily carry the popular vote with 51%-to-47%. A comfortable margin.
Yet something very un-scientific is happening today...
News pundits, social media and Trump's twitter account have resurrected the claim "The Polls were Wrong".
FiveThirtyEight's Nate Silver is (again) being lampooned for being "Way off".
I find this chorus to be baseless for three reasons:
- Statistics: The outcomes were in-line with poll predictions and the Sample vs Population variance.
- Engineering: The model which I built in July matched almost exactly to the FiveThirtyEight model released later this summer. The corroboration between our two models was so thorough as to be spooky.
- Capitalism: Placing bets based with the polling data, I won nearly every single market with a healthy $50,000 return. The consistency between outcome and prediction was over 90%.
Many economist argue that markets are the ultimate source of statistical truth.
The "Efficient Market" weights all current information and viewpoints. When a new trader enters the market, they will be rewarded or punished in proportion to how much they improve the collective base of information.
Through this lens, the polling model 'beating the market' to the tune of 250% with very little risk is a strong endorsement of the validity of polls.
In fact, the final election outcome was actually the median outcome from FiveThirtyEight's model:
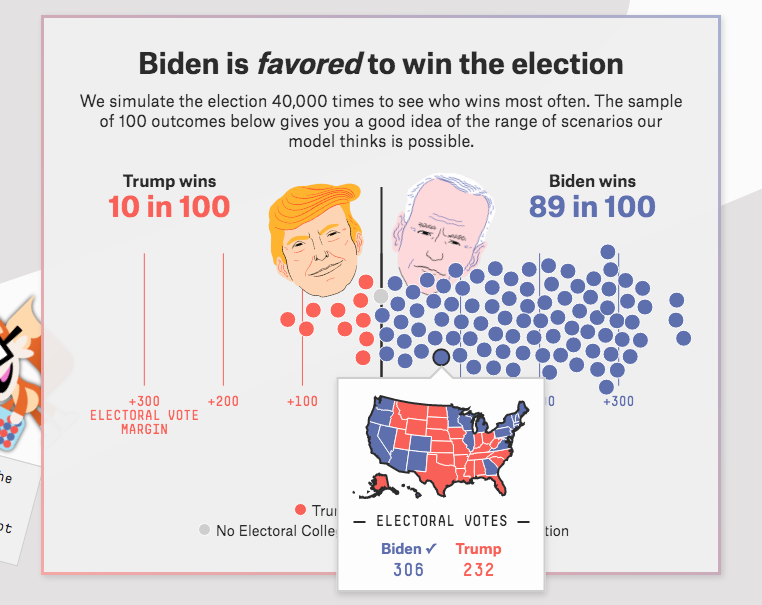
This was also not a one-off bet which could be attributed to luck, but rather a carefully constructed portfolio of 130 separate markets.
In truth, modern polls are very accurate and deeply scientific. Especially when sourced from reputable pollsters and properly weighted.
If the conversation were more numerate or scientific, we would be congratulating Nate Silver and his team of statistician journalists for hitting a home run!
Accuracy & Adjustment
I will take this opportunity to propose two types of adjustment for improving survey data. One which is applied cross-sectionally to polls and another cross-sectionally in time.
First, individual polls are sensitive to the survey method used. Whether conducted in-person, by phone, internet or by some other means or combination, the survey will bias toward certain age, gender and personality characteristics which correlate with the questions being asked. Even time of day will affect the polling results.
The best method to remedy these consistent biases, is through calibration. Each pollster and method can be compared to final outcome at the election to determine the systemic error. That delta is then subtracted from those pollsters going forward.
These types of sampling errors are, fortunately, quite consistent. FiveThirtyEight already utilizes this adjustment in their combined polling.
This adjustment is a classic example of Precise but not Accurate.
For further reading: A famous example of selection bias occurred in the 1936 Franklin Roosevelt election.
The second adjustment is something I'll call the "Delta of Disgust".
Delta of Disgust is how much individual events/polls/questions need to be adjusted for a factor of shame (or pride).
When a political position (support for a politician/policy, opposition to a war, etc) carries a negative social connotation, people will often lie to pollsters. They will hold opposite internal and external positions.
Since there is no gain in accurately answering a survey, it is common to lie and save some small embarrassment. Periods of public passion, disgust or sadness are ripe for this type of error.
Examples include support of sweeping military action after 9/11 or public sentiment after George Floyd's death.
For a deeply divisive figure, like Donald Trump, it was common for his supporters to lie about their loyalties when asked. It appears that about 12% of Trump supporters were untruthful in surveys.
An opposite example occurred after John Kennedy's death. Exactly 50% of voters had supported Kennedy for President in 1960, but asked after his assassination in 1963, 65% of voters claimed to have voted for Kennedy.
Put another way, 30% of Nixon voters claimed to be Kennedy voters as public mourning gripped the nation.
Scientific Progress
Even without the proposed adjustments, polling science has proven itself to be powerful and reliable. Like other sciences, it is continually improving...
Unfortunately, we live in a time where these discussions are rarely numerate and logical.
Despite the success of pollsters and statisticians in 2016, 2018 and 2020, the claims of inaccuracy continue to be appealing and numerous.
I share my model and betting results is not only defend polling, but sciences in general. Too often, a sloppy media story or misreading of scientific data sets us back as a society.
Similar anti-science rhetoric is spreading in vaccines, climate science, biology and the COVID-19 pandemic. The eroding of public trust is costing lives and hurting the economy.
This week's events and distrust of polls are mostly innocuous. But the larger anti-science movement will continue to gain momentum. I truly hope that as technology connects the world, our discussions will become more factual and numerate, not less.
Until then, I remain a solid fan of the journalism and statistics practiced by FiveThirtyEight, Nate Silver and other similar publications.
For my Python code or information about the model, check out the full series.
To reach me personally: nickyoder10@gmail.com