The Kelly Criterion
How to apply the famous betting formula in investment, trading and professional gambling


Most traders have heard of the “Kelly Criterion”.
Developed in 1956 by Bell Labs scientist John Kelly, the formula applied the newly created field of Information Theory to gambling and investment. Kelly Criterion calculates the proportion of one’s net worth to wager in order to maximize longterm wealth.
Although the Kelly Criterion is often referenced in betting and financial circles, it is poorly understood. Its misuse has led to the ruin of many would-be traders.
The rise of Crypto and Tech has created a generation trader-millionaires and even more who have seen their wealth explode and then collapse to zero.
The line between YOLO-ing leverage into certain defeat and longterm profit is written in the language of mathematics. It's name is Kelly Criterion.
The Hardest Problem
Two keys are needed to unlock success in professional gambling, trading and investing:
- Profitable opportunities
- Sizing investments/bets (correctly)
All traders know that #1 is the easy part. Problem #2 separates amateurs from professionals.
“Trading correctly is 90% money and portfolio management.” -Michael W. Covel-
Put another way: A trader with a mediocre strategy and a great risk model will become fairly successful. A trader with a great strategy and a mediocre risk model will become bankrupt.
Instances of this problem include a blackjack player deciding what percentage of his bankroll to wager on a given hand, a real estate investor deciding how much of her portfolio to commit to a new property, and a crypto trader deciding what leverage to apply to a new strategy.
A Simple Example
Imagine a betting opportunity which offers positive expected value with known payouts and probabilities. For example, a card counter playing blackjack who knows that the current Running count and True count imply a win/loss probability for the next hand of 52% vs 48%.
A 52% chance of winning is certainly attractive, but how much of the gambler’s total bankroll (net worth) should he wager on the next hand?
The professional gambler must balance the competing forces of betting more to achieve greater profit and betting less to limit the chance of going bankrupt.
Somewhere between the extremes, there should be an optimal proportion of total bankroll to bet, such that long-term wealth is maximized.
A simple experiment can be constructed to test different bet sizes over 1,000 simulated hands of Blackjack.
In the first example, the gambler wagers 1% of his bankroll on each hand. Plotting the course of his net worth over 1,000 simulated hands:
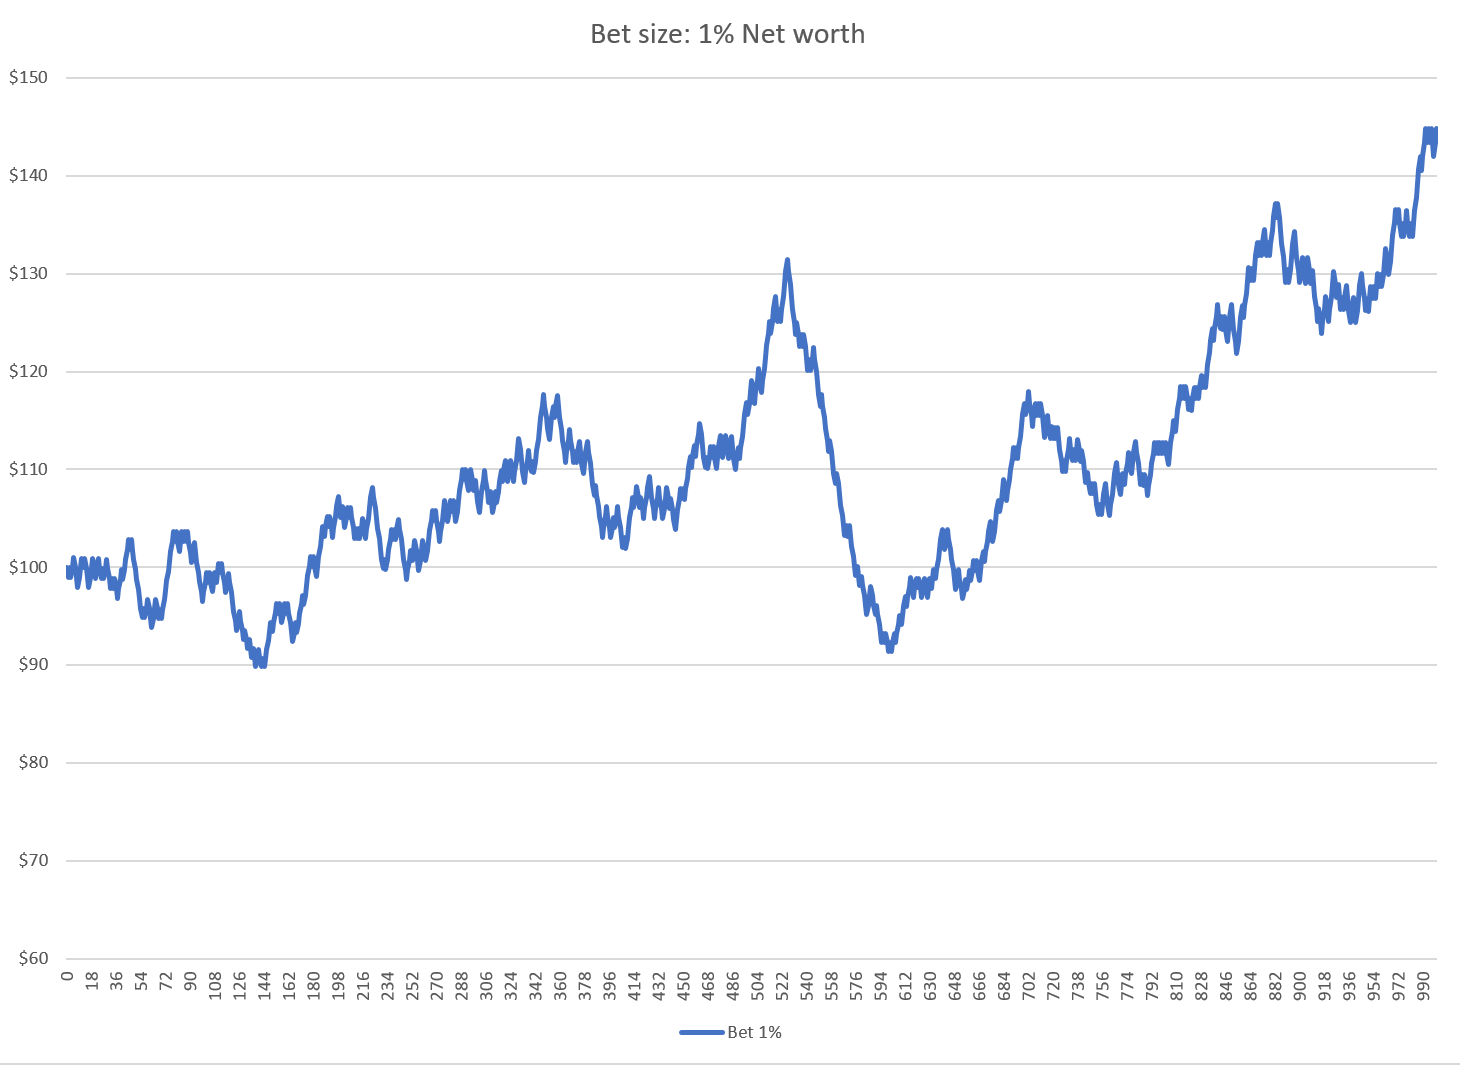
This strategy makes a nice return over time, with a bit of volatility. After 1,000 hands, the gambler has increased his wealth by 44%.
What if the gambler risks a larger proportion of his net worth on each bet? The next chart shows his profit over time with bet sizes of 1%, 2%, and 4% of net worth per hand:
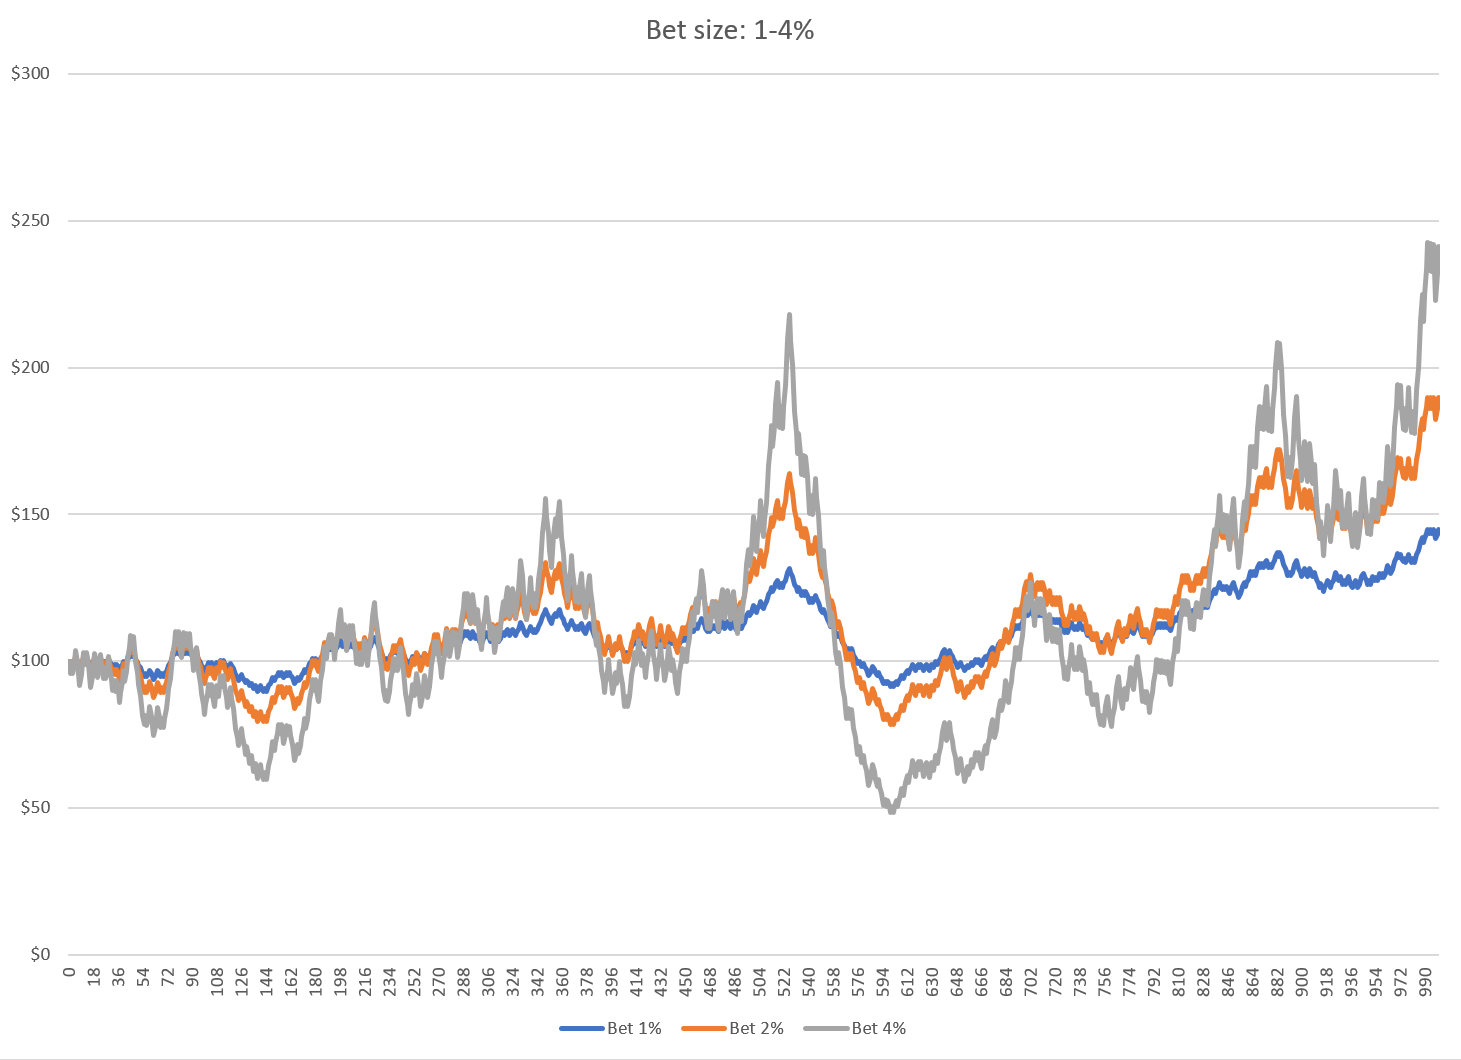
It’s not surprising that as the bet size increases, so does profit and the variance of the gambler’s net worth. Cumulative winnings steadily grow as the bet size increases from 1% to 4%.
Continuing with even larger bets, something counter-intuitive creeps into the simulation.
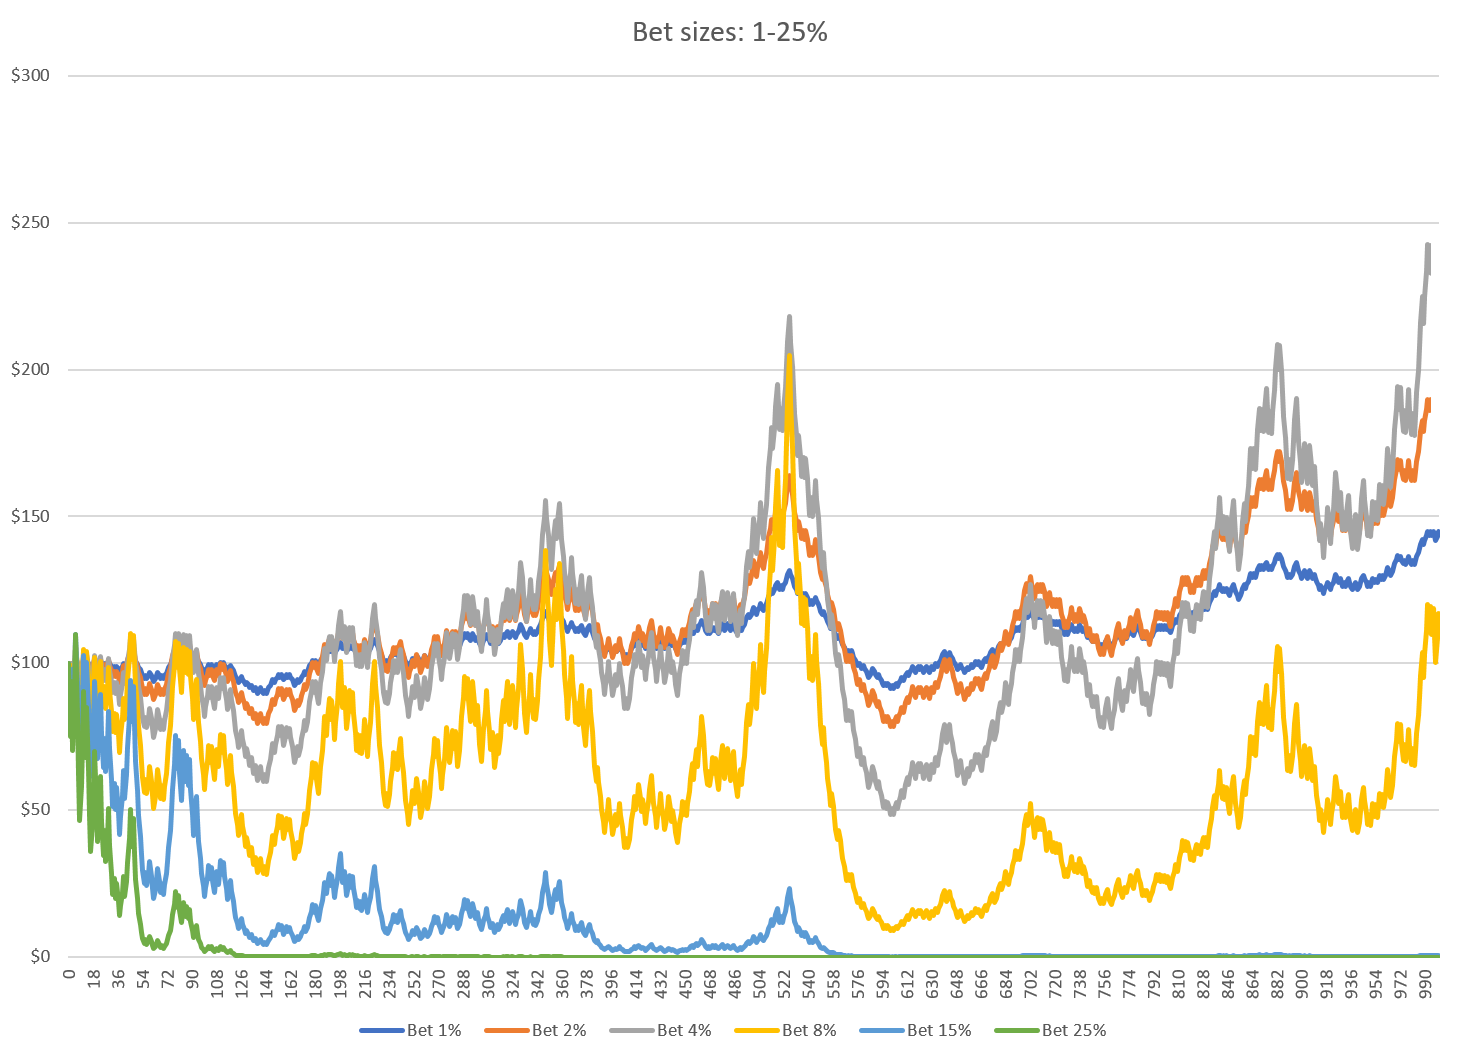
8% bets cause the growth to suffer. Even larger bets of 15% or 25% bankrupt the gambler.
He is losing money with winning bets!
Larger and larger wagers continually increase the variance of his net worth, but beyond a point, his profits peak and then reverse.
Why would doing more of a good thing result in a worse long-term outcome?
The Numbers
To understand this rise and fall in returns, imagine a very good gambling opportunity: A bet with 50/50 probability and a payout of 2:1 ($2 gain for $1 wagered).
Clearly this is a profitable opportunity, but how much should be invested in each round of the bet?
In the previous example, 1,000 rounds of betting were simulated. This time, a more mathematical approach is helpful.
Since the bet wins or loses with equal probability (50/50), an 'Average' round of betting can be defined as having an equal number of wins and loses. The simplest model of bets would be one win and loss (order doesn't matter).
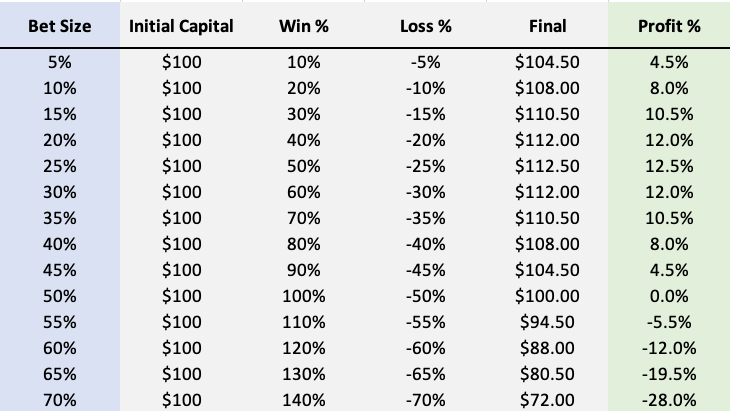
As bet size (left column) increases so do the win and loss size. The total profit (right column) increases with bet size, but then plateaus and falls.
A wager of 40% per round is equally as profitable as 10% per round. 60% actually loses money on average, but why?
The losses are caused by 'Negative Geometric Drag' or 'NGD'.
This is the “drag” on a portfolio’s profit results arithmetically from gaining and losing the same Proportion of value. A gain of X% followed by a loss of X% (or a loss followed by a gain), will always result in a net loss.
A loss of 10% on an investment followed by a 10% gain results in a 0.99 of the original investment (0.90 x 1.10 = 0.99) or a 1% net loss. Profiting 20% then losing 20% nets a 4% loss from the starting point (1.20 x 0.8 = 0.96).
The drag on an investment’s return is the square of the gain/loss.
Here’s a table of win/loss bets with no edge (Win % = Loss%). Notice how the Negative Geometric Drag is the square of the bet size (leverage).
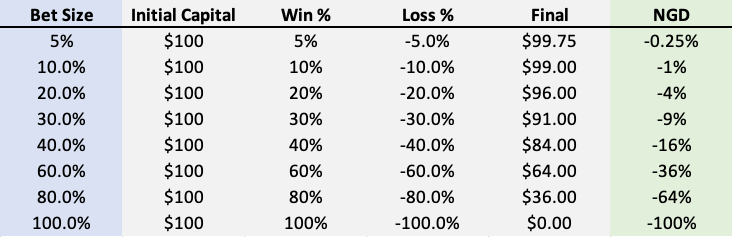
By separating Edge (linear) and NGD (square), a more complete picture of portfolio profit is appears.
Here’s the same 2:1 payout investment as before. Now the components of Edge, NGD and Profit are broken out individually.
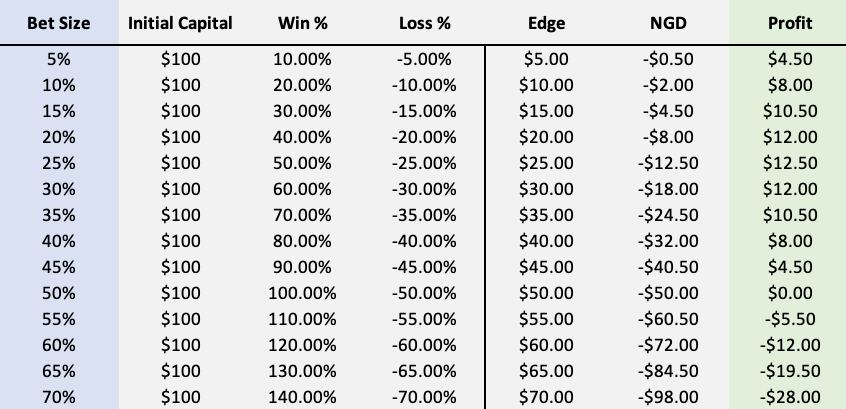
As leverage is increased, the Edge of a bet grows linearly with the amount of leverage, but the Negative Geometric Drag (NGD) grows as the square of the leverage.
At lower levels of leverage, the edge is the dominant force and the NGD is negligible. However, as leverage grows, the NGD becomes larger and eventually overwhelms the betting edge.
Shown graphically, these figures create the familiar 'Kelly Curve' (Blue).
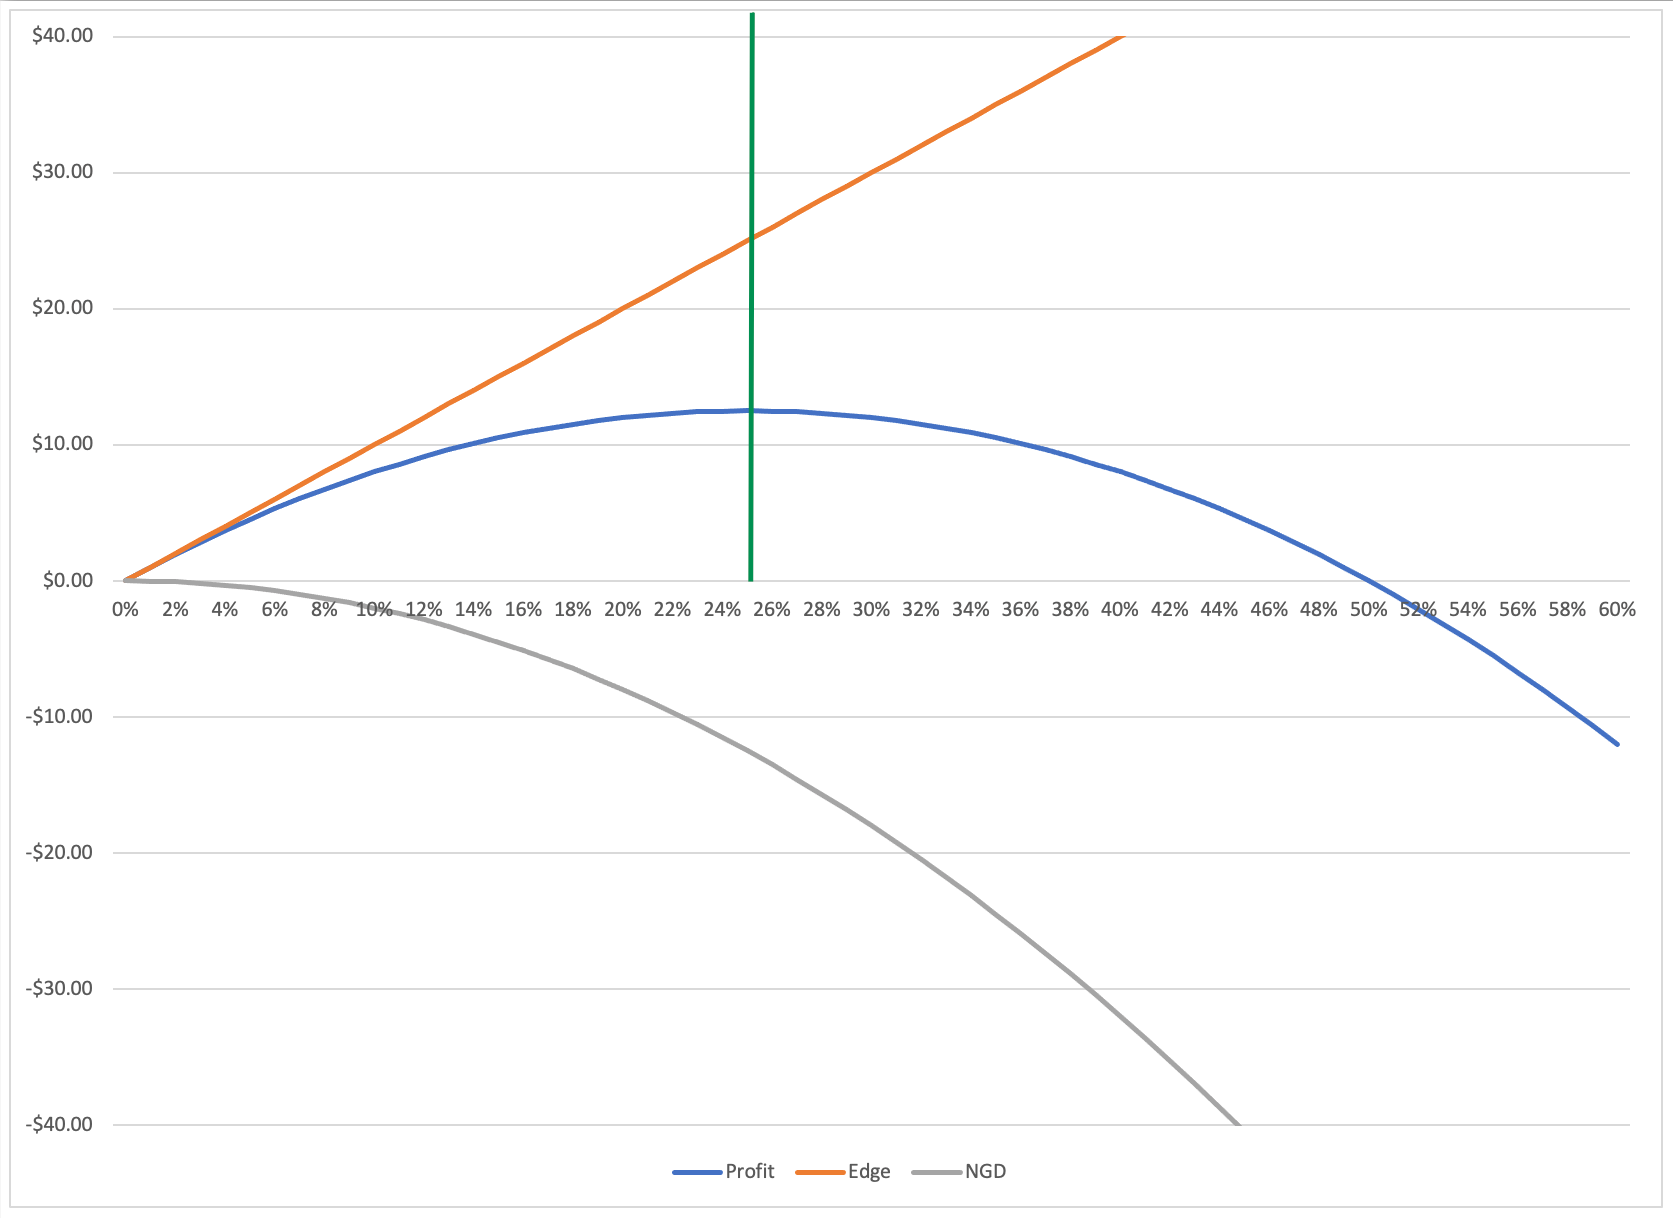
Profit (blue) is the sum of the ever increasing Edge*Leverage and the Negative Geometric Drag (Leverage^2).
The green vertical line indicates where the two countervailing forces perfectly offset each other (Marginal Edge = Marginal NGD). This is the point of maximum profit (Bet Size = 0.25), any additional leverage would result in lower profit.
To state this another way, using this betting size (0.25 of net worth) would maximize the Geometric Growth Rate wealth over time.
The Kelly Criterion
The Kelly Criterion formalizes this logic into one formula. It accepts known probabilities and payoffs as inputs and returns the proportion of total wealth to bet for maximum growth.
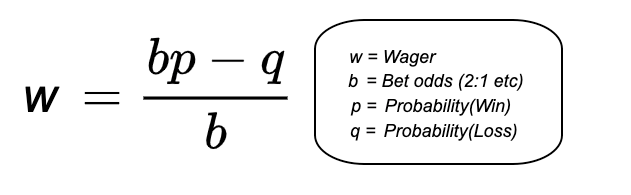
The example above would set b=2, p=0.5 and q=0.5. Wager size solves to 0.25, exactly the same value as the trial-and-error table above!
Example #2: What about a startup investment or ICO that has a 15% chance of success but a 30x payoff?
A question like this is tough to work out intuitively, but the Kelly Criterion advises an investment of 12% of total capital.
Returning to the card counter from the introduction, b=1 p=0.52 q=0.48.
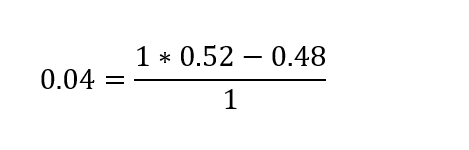
The gambler should bet 4% of his bankroll. Exactly as predicted.
But how do these principles hold up in the real world?
ETH Trading
Ethereum trading offers an excellent real-world application of Kelly.
A particular ETH long volatility/trend-following strategy has the following returns (2016-Present).
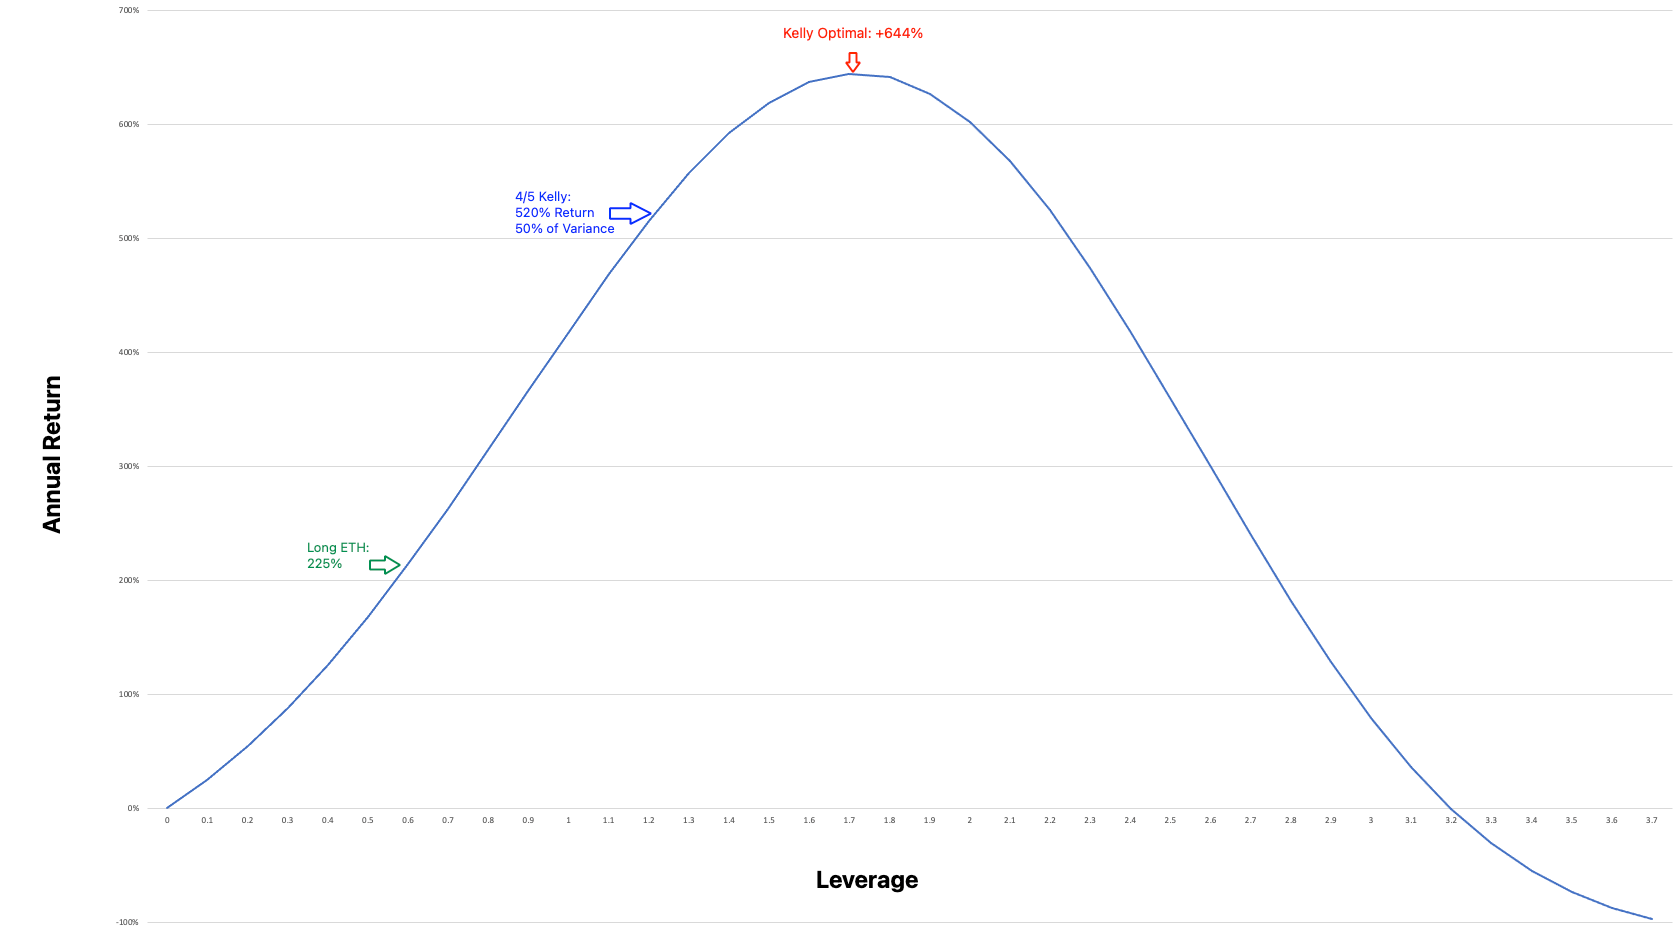
The long volatility strategy has a maximum (Kelly Optimal) return of 644% per year vs. 225% for holding long ETH (2016-Present).
This optimal return used 1.7x leverage. 1x, 2x and 4x leverage would have returned +418%, +602% and -99% (total loss) annually. By utilizing too much or to little leverage, the trader can easily miss out on opportunity or even lose everything.
The Kelly Optimal bet is a fine line based on a solid understanding of the probabilities and returns.
Kelly ≠ Goal
Kelly = Limit
The Kelly Criterion only defines the 'Optimal' bet to maximize return. It does not use caution or assign value to risk.
Kelly represents the limit to the range of rational investments. It is simply the largest bet that could still be rational assuming no value is placed on risk.
Betting even one penny more than Kelly would bring increased risk, increased variance and decreased profit.
However, betting anywhere near the Kelly-optimal amount is irrational by most standards.
As the bet size approaches the Kelly-optimal point, the ratio of additional risk to additional profit goes to infinity. Eventually the investor would have to risk an additional one billion dollars to earn one cent more of expected profit.
Most people assign a negative value to risk. That’s why we pay a premium to insurance companies to haul away excess risk.
As a result, professional traders use a leverage that is partway up the Kelly Curve.
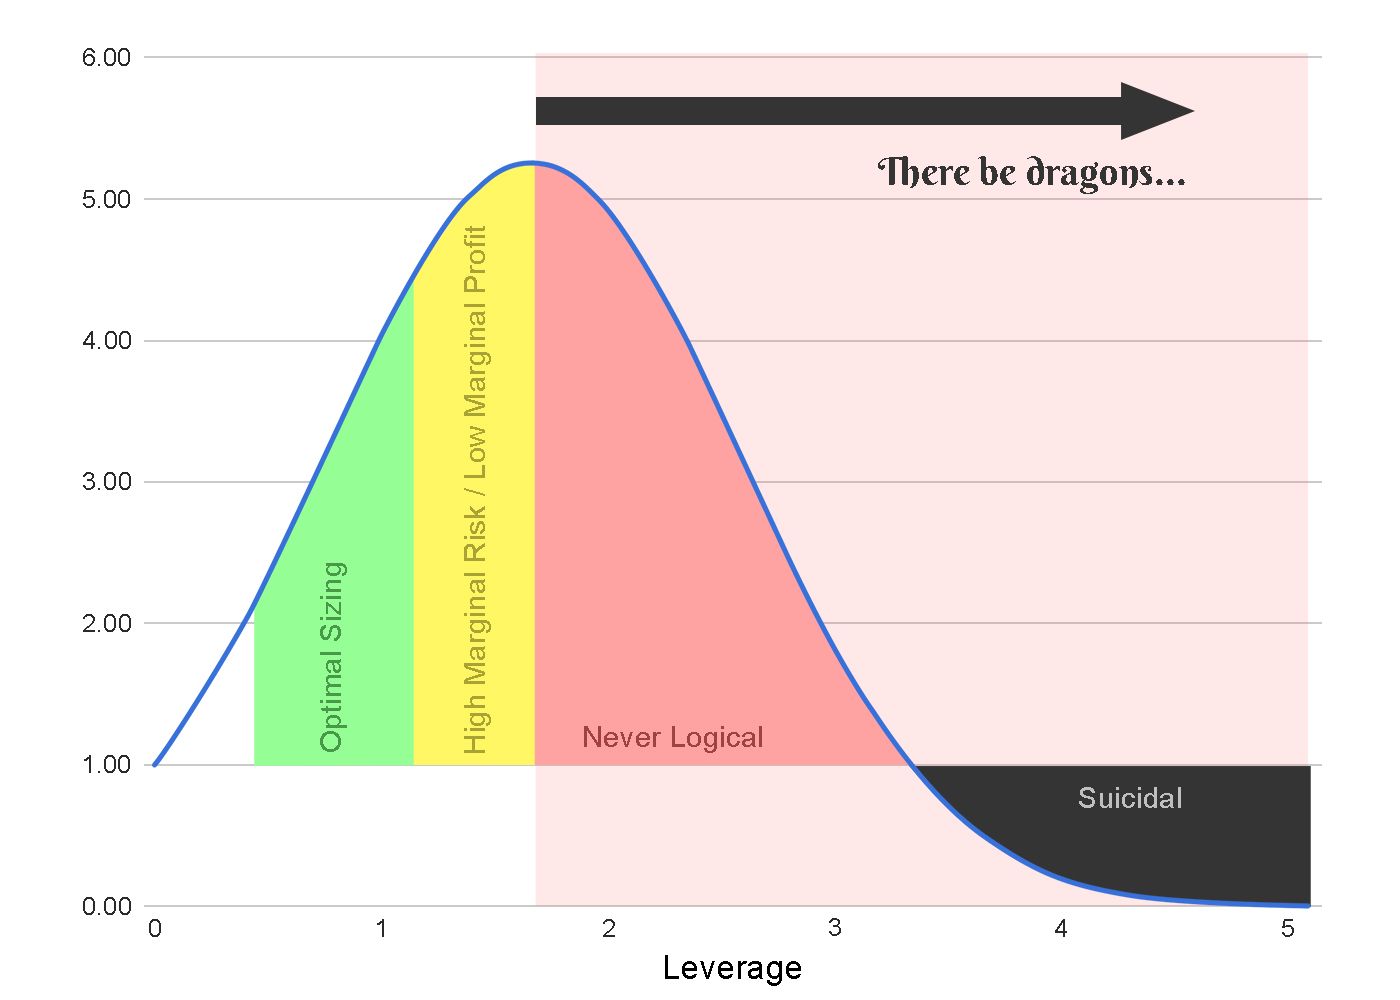
The ETH strategy had a Kelly optimal leverage of 1.7x yielding 644% annualized return. But a leverage of just 1.3x returned 520% annual profit with only half of the variance.
The Sharpe Ratio (Return / Variance) also improves with lower fractions of Kelly. The more modest leverage of 1.3x improves the Sharpe of the ETH strategy from 1.90 to 3.04.
As rule-of-thumb, many traders use "Half-Kelly" which offers 75% of the maximum profit with just 25% of the variance. This is a 3x better risk-adjusted return.
“There are old traders, and there are bold traders. There are very few old, bold traders.” -Ed Seykota-
Summary
The Kelly Criterion is an excellent tool for assessing the qualitative shape of 'Risk vs. Reward' and understanding the boundaries rational bets. While it does not assign value to risk, simple heuristics like 'Half-Kelly' are enough for real world application.
Kelly Criterion is one of a few essential models for the quantitative trader.
In a market of ballooning asset prices and easy leverage, many traders feel very smart before moments before going bankrupt.
However, traders with discipline, patience and quantitative skills are able to profit from the amateur and emotional. Theirs is a long career of ever greater success.
(Optional)
For further reading, here are two excellent books covering the history of markets and the Kelly Criterion:
- Fortune’s Formula by William Poundstone
- A Man for All Markets by Ed Thorp
(Optional)
The October issue of Luckbox will dive more deeply into quantitative strategies, crypto markets and multi-asset Kelly.